
Table of Contents
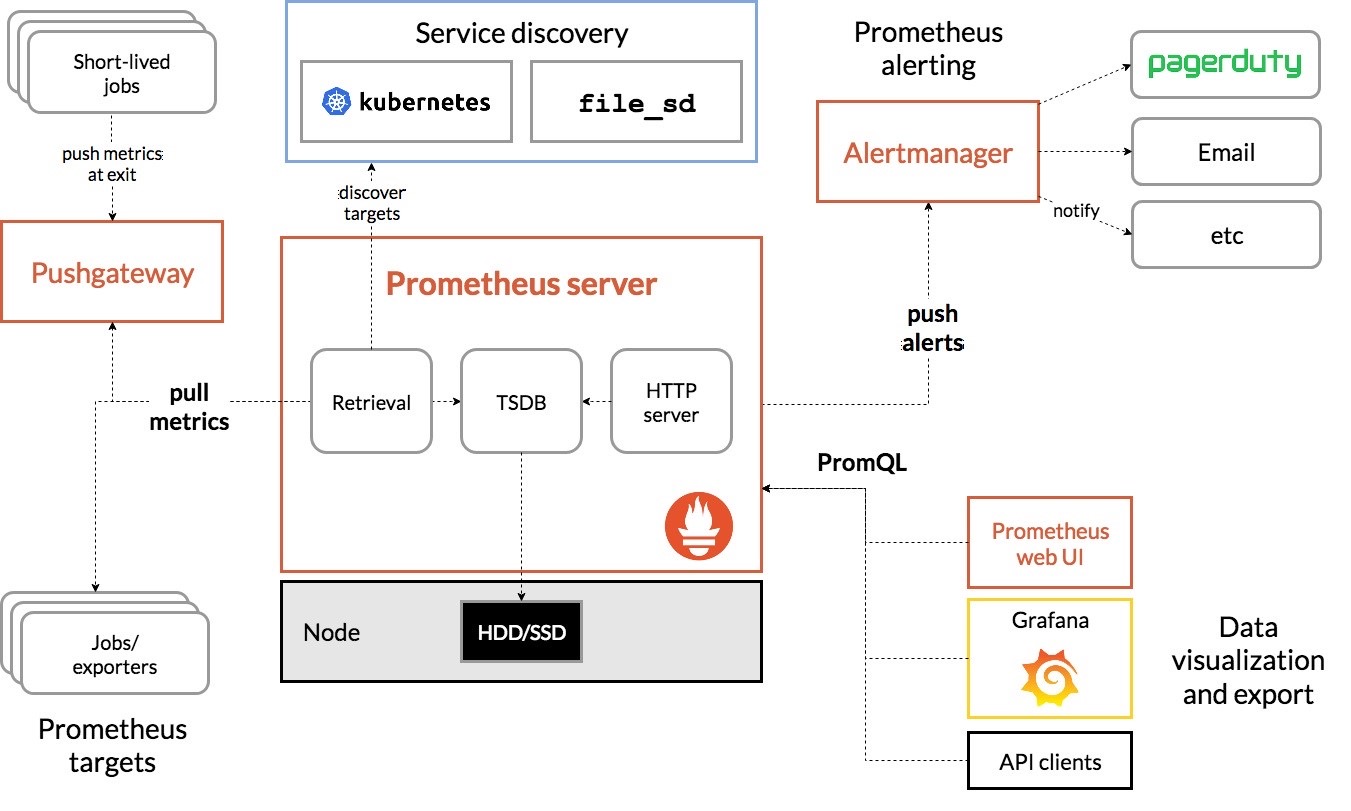
Prometheus 架構圖
Prometheus 安裝方法
下載 Prometheus
https://prometheus.io/download/
解壓縮至特定目錄
下載後,解壓縮至目錄
tar xvfz prometheus-*.tar.gz
cd prometheus-*
mv prometheus-* /usr/local/prometheus
設定服務啟動檔
systemd 啟動檔範例:
[Unit]
Description=Prometheus monitor service
After=network.target rsyslog.target
Wants=network.target

[Service]
Type=simple
ExecStartPre= /usr/local/prometheus/promtool check config /usr/local/prometheus/prometheus.yml
ExecStart=/usr/local/prometheus/prometheus \
            --config.file=/usr/local/prometheus/prometheus.yml \
            --storage.tsdb.path=/usr/local/prometheus/data \
            --log.level=warn \
            --web.external-url=https://prometheus.awoomail.com:443/
ExecReload=/bin/kill -s HUP $MAINPID
ExecStop=/bin/kill -s QUIT $MAINPID
PrivateTmp=true
Restart=on-failure

[Install]
WantedBy=multi-user.target
啟動服務,以及設定開機啟動
systemctl enable prometheus.service
systemctl start prometheus.service
Prometheus 設定檔
# my global config
global:
  scrape_interval:     15s # Set the scrape interval to every 15 seconds. Default is every 1 minute.
  evaluation_interval: 15s # Evaluate rules every 15 seconds. The default is every 1 minute.
  # scrape_timeout is set to the global default (10s).

# Alertmanager configuration
alerting:
  alertmanagers:
  - static_configs:
     - targets: ['127.0.0.1:9093']

# Load rules once and periodically evaluate them according to the global 'evaluation_interval'.
rule_files:
  - "rules/*_rules.yml"
  - "rules/*_alerts.yml"

# A scrape configuration containing exactly one endpoint to scrape:
# Here it's Prometheus itself.
scrape_configs:
  # The job name is added as a label job=<job_name> to any timeseries scraped from this config.
  - job_name: 'prometheus'

    # metrics_path defaults to '/metrics'
    # scheme defaults to 'http'.

    static_configs:
    - targets: ['localhost:9090']

  - job_name: 'node_gce'
    gce_sd_configs:
      - zone: 'asia-east1-a'
        project: 'asia-mail-awoo-org'
        filter: name != "pro-sch-sns-go-03" AND name != "image*" AND name != "stage*" AND name != "instance-group-stage*"
      - zone: 'asia-east1-b'
        project: 'asia-mail-awoo-org'
        filter: name != "pro-sch-sns-go-03" AND name != "image*" AND name != "stage*" AND name != "instance-group-stage*"
      - zone: 'asia-east1-c'
        project: 'asia-mail-awoo-org'
        filter: name != "pro-sch-sns-go-03" AND name != "image*" AND name != "stage*" AND name != "instance-group-stage*"
    relabel_configs:
    - source_labels: ['__meta_gce_public_ip']
      target_label: '__address__'
      replacement: "${1}:9100"
    - source_labels: ['__meta_gce_zone']
      regex: ".+/([^/]+)"
      target_label: 'zone'
    - source_labels: ['__meta_gce_project']
      target_label: 'project'
    - source_labels: ['__meta_gce_instance_name']
      target_label: 'instance'
    #- regex: "__meta_gce_metadata_(.+)"
      #action: 'labelmap'

  - job_name: 'proxmox'
    static_configs:
    - targets: ['10.102.2.31:9100']
      labels:
        instance: 'mox1s1'
    - targets: ['10.102.2.32:9100']
      labels:
        instance: 'mox1s2'
    - targets: ['10.102.2.33:9100']
      labels:
        instance: 'mox1s3'
    - targets: ['10.102.2.34:9100']
      labels:
        instance: 'mox1s4'
    - targets: ['10.102.2.20:9100']
      labels:
        instance: 'mox1s1-pc'
    - targets: ['10.102.2.21:9100']
      labels:
        instance: 'mox1s2-pc'
    - targets: ['10.102.2.22:9100']
      labels:
        instance: 'mox1s3-pc'
    - targets: ['10.102.2.23:9100']
      labels:
        instance: 'mox1s4-pc'
    - targets: ['10.102.0.1:9100']
      labels:
        instance: 'mox2s1'
    - targets: ['10.102.0.2:9100']
      labels:
        instance: 'mox2s2'

  - job_name: 'idc_mail'
    dns_sd_configs:
    - names:
      - mox1s1.awoomail.com.
      - mox1s2.awoomail.com.
      - mox1s4.awoomail.com.
      - mox1s1-pc.awoomail.com.
      - mox1s2-pc.awoomail.com.
      - mox1s3-pc.awoomail.com.
      - mox1s4-pc.awoomail.com.
      - mox2s1.awoomail.com.
      - mox2s2.awoomail.com.
      - rec.awoomail.com.
      refresh_interval: 3600s
      type: SRV
    relabel_configs:
    - source_labels:  ["__meta_dns_name"]
      regex:         '(.+?)\.awoomail\.com\.'
      target_label: "host"
      replacement:   '$1'
    - source_labels:  ["__address__"]
      regex:         '(.+?)\.awoomail\.com:9100'
      target_label: "instance"
      replacement:   '$1'
  - job_name: 'smtp_status'
    scrape_interval:     30s
    metrics_path: /probe
    params:
      module: [smtp_banner]
    dns_sd_configs:
    - names:
      - mox1s1.awoomail.com.
      - mox1s2.awoomail.com.
      - mox1s4.awoomail.com.
      - mox1s1-pc.awoomail.com.
      - mox1s2-pc.awoomail.com.
      - mox1s3-pc.awoomail.com.
      - mox1s4-pc.awoomail.com.
      - mox2s1.awoomail.com.
      - mox2s2.awoomail.com.
      refresh_interval: 300s
      type: SRV
    relabel_configs:
    # Ensure port is 25, pass as URL parameter
    - source_labels: [__address__]
      regex: '(.+?):9100'
      replacement: ${1}:5566
      target_label: __param_target
    # Make instance label the target
    - source_labels: [__param_target]
      regex:         '(.+?)\.awoomail\.com:5566'
      target_label: instance
    - source_labels:  ["__meta_dns_name"]
      regex:         '(.+?)\.awoomail\.com\.'
      target_label: "host"
      replacement:   '$1'
    # Actually talk to the blackbox exporter though
    - target_label: __address__
      replacement: 127.0.0.1:9115
rule 範例
groups:
- name: node_rules
  rules:
  - record: instance:node_cpu:avg_rate5m
    expr: 100 - (avg(irate(node_cpu_seconds_total{mode="idle"}[5m])) by (instance, host, job) * 100)
  - record: instance:node_cpus:count
    expr: count by (instance, job)(node_cpu_seconds_total{mode="idle"})
  - record: instance:node_cpu_saturation_load1
    expr: node_load1 > on (instance) 2 * count by (instance, job)(node_cpu_seconds_total{mode="idle"})
  - record: instance:node_memory_usage:percentage
    expr: node_memory_MemAvailable_bytes / node_memory_MemTotal_bytes * 100
  - record: instance:node_swap_usage:percentage
    expr: node_memory_SwapFree_bytes / node_memory_SwapTotal_bytes * 100
  - record: instance:node_memory_swap_io_bytes:sum_rate
    expr: 1024 * sum by (instance, job) (
                 (rate(node_vmstat_pgpgin[1m])
                 + rate(node_vmstat_pgpgout[1m]))
          )
  - record: instance:root:node_filesystem_usage:percentage
    expr: (node_filesystem_size_bytes{mountpoint="/", fstype=~"(ext4|xfs)"} - node_filesystem_free_bytes{mountpoint="/", fstype=~"(ext4|xfs)"}) / node_filesystem_size_bytes{mountpoint="/", fstype=~"(ext4|xfs)"} * 100
  - record: instance:node_network_throughput_in:M
    expr: sum by (job, instance, device) (irate(node_network_receive_bytes_total[2m])) / 1024 / 1024
  - record: instance:node_network_throughput_out:M
    expr: sum by (job, instance, device) (irate(node_network_transmit_bytes_total[2m])) / 1024 / 1024
groups:
- name: node_alerts
rules:
- alert: HighNodeCPU
expr: instance:node_cpu:avg_rate5m > 80
for: 60s
labels:
severity: warning
annotations:
summary: "主機 {{ $labels.instance }} CPU 使用率異常\n"
description: "CPU 使用率超過 80%\n\t目前主機 CPU 使用率 = {{ $value }}\n"
- alert: HighNodeMem
expr: instance:node_memory_usage:percentage < 20
for: 5m
labels:
severity: warning
annotations:
summary: "主機 {{ $labels.instance }} 記憶體即將用盡\n"
description: "主機記憶體剩餘量小於 10%\n\t目前剩餘量 = {{ $value }}%\n"
- alert: HighNodeSwap
expr: instance:node_swap_usage:percentage < 40
for: 5m
labels:
severity: warning
annotations:
summary: "主機 {{ $labels.instance }} 的 swap 即將用盡\n"
description: "主機 swap 剩餘量小於 10%\n\t目前剩餘量 = {{ $value }}%\n"
- alert: HostOutOfDiskSpace
expr: instance:root:node_filesystem_usage:percentage > 85
for: 5m
labels:
severity: warning
annotations:
summary: "主機 {{ $labels.instance }} 硬碟空間即將用盡\n"
description: "主機剩餘使用空間小於 15%\n\t空間已使用 = {{ $value }}\n"
- alert: DiskWillFillIn4Hours
expr: predict_linear(node_filesystem_free_bytes{mountpoint="/", fstype=~"(ext4|xfs)"}[1h], 4*3600) < 0
for: 5m
labels:
severity: critical
annotations:
summary: "主機 {{ $labels.instance }} 硬碟空間可能會被用盡"
description: "\n\t主機 {{$labels.instance}} 硬碟空間 {{$labels.device}}\n\t依照目前使用情形,將在 4 小時內把使用空間耗盡"
- alert: HostOutOfInodes
expr: node_filesystem_files_free{mountpoint ="/", fstype=~"(ext4|xfs)"} / node_filesystem_files{mountpoint ="/", fstype=~"(ext4|xfs)"} * 100 < 5
for: 5m
labels:
severity: warning
annotations:
summary: "主機 {{ $labels.instance }} inodes 數量即將用盡\n"
description: " 主機剩餘 inodes 數量 小於 5%\n\t目前剩餘可用數量 = {{ $value }}%\n"
- alert: InstanceDown
expr: up == 0
for: 30s
labels:
severity: critical
annotations:
summary: "Host {{ $labels.instance }} is down!\n"
description: "主機 {{ $labels.instance }} 關機?\n\t請儘速確認主機狀況\n"
- alert: InstancesGone
expr: absent(up)
for: 30s
labels:
severity: critical
annotations:
summary: Host {{ $labels.instance }} is no longer reporting!
- alert: NodeServiceDown
expr: node_systemd_unit_state{state="active"} != 1
for: 60s
labels:
severity: critical
annotations:
summary: "Host {{ $labels.instance }} 上的服務 {{ $labels.name }} 掛掉了!\n"
description: "服務 {{ $labels.name }} 掛掉了\n\t請儘速查明狀態及發生原因!"
- name: idc_alerts
rules:
- alert: HostUnusualNetworkThroughputIn
expr: instance:node_network_throughput_in:M{job='idc_mail'} > 30
for: 5m
labels:
severity: warning
annotations:
summary: "主機 {{ $labels.instance }}) 接收速率異常\n"
description: "主機接收速率超過 30 MB/s\n\t目前接收速率 = {{ $value }}\n"
- alert: HostUnusualNetworkThroughputOut
expr: instance:node_network_throughput_out:M{job='idc_mail'} > 10
for: 5m
labels:
severity: warning
annotations:
summary: "主機 {{ $labels.instance }} 對外流量異常\n"
description: "主機對外流量超過 10 MB/s\n\t目前對外流量 = {{ $value }}\n"
- name: promox_alerts
rules:
- alert: HostUnusualNetworkThroughputIn
expr: instance:node_network_throughput_in:M{job='proxmox'} > 150
for: 5m
labels:
severity: warning
annotations:
summary: "主機 {{ $labels.instance }}) 接收速率異常\n"
description: "主機接收速率超過 150 MB/s\n\t目前接收速率 = {{ $value }}\n"
- alert: HostUnusualNetworkThroughputOut
expr: instance:node_network_throughput_out:M{job='proxmox'} > 30
for: 5m
labels:
severity: warning
annotations:
summary: "主機 {{ $labels.instance }} 對外流量異常\n"
description: "主機對外流量超過 30 MB/s\n\t目前對外流量 = {{ $value }}\n"
- name: gcp_alerts
rules:
- alert: HostUnusualNetworkThroughputIn
expr: instance:node_network_throughput_in:M{job='node_gce'} > 100
for: 5m
labels:
severity: warning
annotations:
summary: "主機 {{ $labels.instance }}) 接收速率異常\n"
description: "主機接收速率超過 100 MB/s\n\t目前接收速率 = {{ $value }}\n"
- alert: HostUnusualNetworkThroughputOut
expr: instance:node_network_throughput_out:M{job='node_gce'} > 100
for: 5m
labels:
severity: warning
annotations:
summary: "主機 {{ $labels.instance }} 對外流量異常\n"
description: "主機對外流量超過 100 MB/s\n\t目前對外流量 = {{ $value }}\n"
